
Microsoft Fabric strengthens Power BI Fabric integration in financial dashboards by providing a unified data foundation through OneLake, integrated data engineering and warehousing, governed semantic models, and capabilities such as Direct Lake and Real-Time Intelligence. Power BI remains the visualization and business analytics layer, while Fabric supports data ingestion, preparation, storage, and analytics across the underlying platform. For financial institutions, Microsoft positions Fabric as a way to consolidate data silos, improve governance, support scalable analytics, and connect Power BI more closely with enterprise data workflows.
Financial dashboards often begin with a manageable number of reports and data sources. As the business grows, however, finance teams need to bring together information from ERP systems, CRM platforms, transaction systems, spreadsheets, investment and portfolio tools, operational databases, and external market data.
Individually, these sources may work well. The challenge appears when financial data must be combined across them. Different systems can contain duplicated records, different transformation logic, and competing versions of the same metric. Revenue, profit, cash flow, or portfolio figures may therefore differ between dashboards and finance reports.
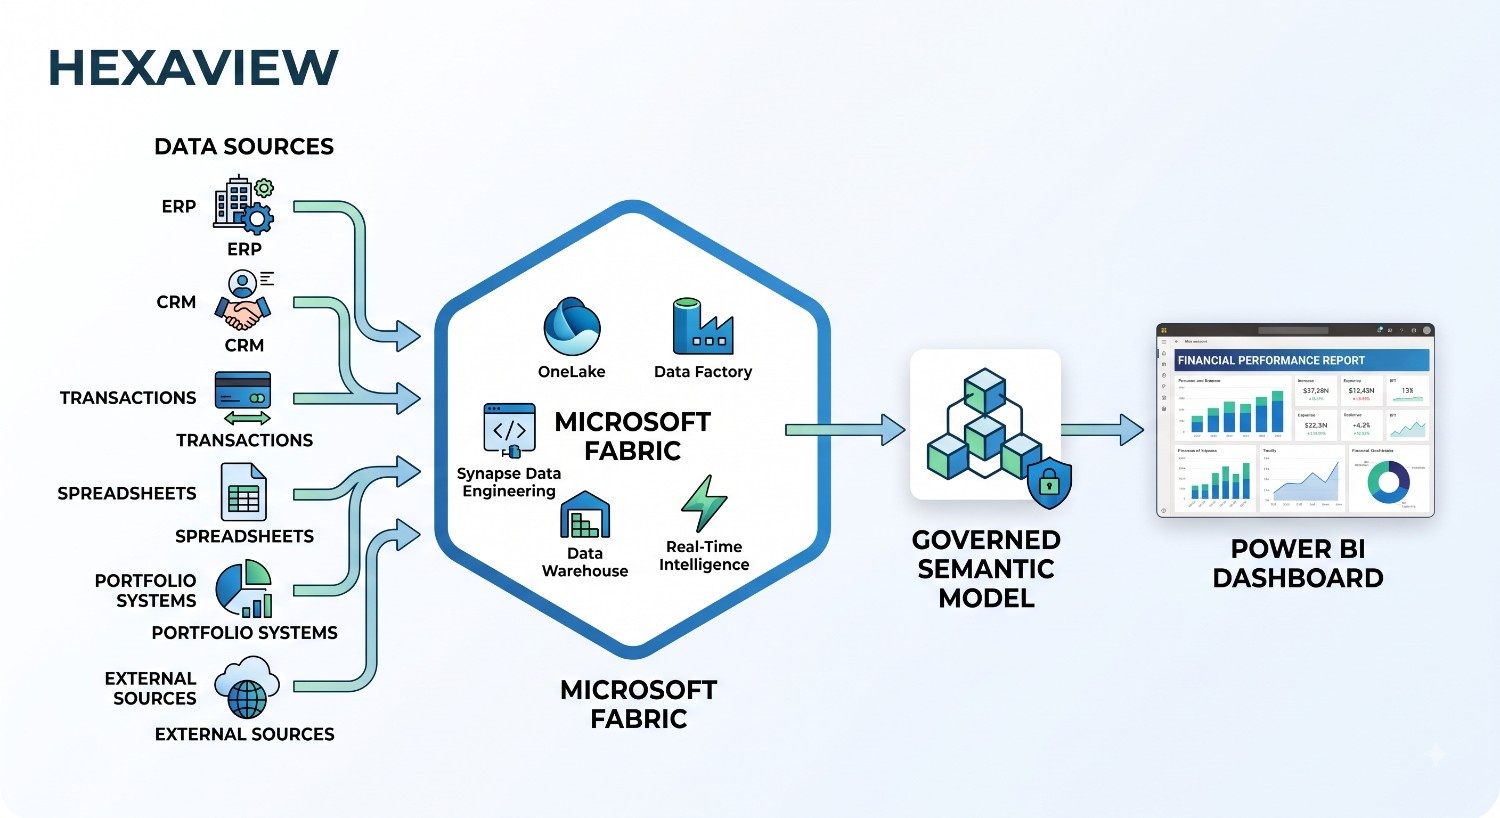
Microsoft Fabric does not automatically eliminate these problems. Its value is architectural: Microsoft Fabric Power BI Integration provides a framework for bringing disparate data together, processing it consistently, applying governance, and making curated data available to Power BI.
This is also where Power BI Modernization with Microsoft Fabric becomes relevant. Instead of trying to resolve fragmented data at the dashboard layer, organizations can address data integration, preparation, governance, and modelling upstream. The result can be a more reliable foundation for scalable financial reporting.
A financial dashboard built with Microsoft Fabric Power BI Integration separates the data platform from the reporting experience. Instead of connecting Power BI directly to numerous operational systems, Fabric provides the architecture for ingesting, storing, preparing, modelling, and governing data before it reaches the dashboard.
The flow typically looks like this:
Financial Data Sources → Fabric Data Factory / Data Integration → OneLake → Lakehouse or Warehouse → Semantic Model → Power BI → Financial Dashboards & Reports
In simple terms: Fabric provides the broader data platform; Power BI provides the business intelligence and visualization experience.
For financial dashboards, the choice between Import, DirectQuery, and Direct Lake affects data freshness, query behavior, and scalability. Microsoft describes Direct Lake as a Fabric-native storage mode that reads Delta-formatted data from OneLake without creating a traditional imported copy in the Power BI semantic model.
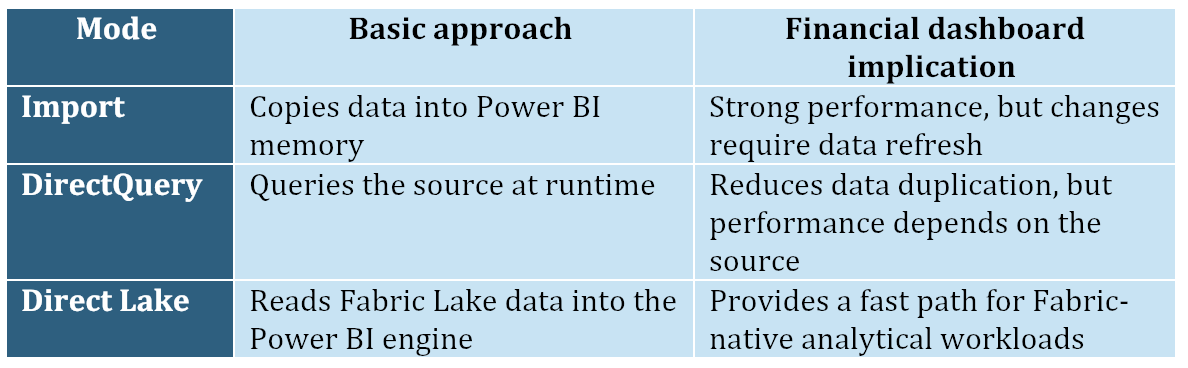
With Direct Lake, the semantic model can load required columns from OneLake as queries need them. This can reduce the traditional import-refresh dependency, particularly for large Fabric datasets with frequent updates.
However, Direct Lake should not be presented as an automatic performance fix. Actual results depend on the semantic model, data layout, workload, capacity, and implementation. Microsoft also recommends prototyping to determine whether Direct Lake is appropriate for a specific solution.
The value of Power BI Fabric integration in financial dashboards becomes clearer when the architecture is applied to specific finance workflows. Fabric can bring together structured, transactional, and real-time data before Power BI presents it through governed analytical models.
Monitors: Revenue, EBITDA, operating expenses, gross margin, budget versus actuals, and year-over-year trends.
Data feeds: ERP, general ledger, budgeting, and operational systems.
Decision: Where is financial performance deviating from plan, and which areas require attention?
Monitors: Actuals, budgets, forecasts, variances, departmental spending, and forecast changes.
Data feeds: Financial planning systems, ERP data, and departmental inputs.
Decision: Where should finance teams investigate variances or revise forecasts?
Monitors: Cash inflows and outflows, working capital, receivables, payables, and liquidity trends.
Data feeds: ERP, banking, accounts receivable, accounts payable, and treasury systems.
Decision: What is affecting short-term liquidity?
Monitors: Transaction volumes, trends, unusual patterns, and operational indicators.
Data feeds: Banking and payment systems, customer data, and streaming transaction events.
Decision: Where are emerging transaction patterns or operational exceptions requiring investigation? Microsoft documents Fabric architectures that combine real-time transaction data, analytics, dashboards, and alerting for financial-services fraud scenarios. Fabric can support these workflows, but it should not be positioned as an automatic fraud-detection solution.
Monitors: Portfolio performance, asset allocation, client-level metrics, and investment trends.
Data feeds: Portfolio management platforms, market data, client systems, and transaction records.
Decision: How are portfolios and investment positions performing across clients, assets, or time periods?
Monitors: Risk indicators, regulatory metrics, exceptions, and compliance-related activities.
Data feeds: Financial systems, operational databases, transaction data, and governed analytical datasets.
Decision: Which risk or compliance indicators require investigation or escalation?
Together, these use cases illustrate the broader role of Microsoft Fabric Power BI Integration. Fabric provides the data and analytics foundation, while Power BI turns governed data into financial reporting and decision-support experiences. For larger organizations, Microsoft Fabric Consulting Services can help determine which workloads belong in the Lakehouse, Warehouse, Real-Time Intelligence environment, or semantic model rather than simply moving existing reports into Fabric.
Power BI Modernization with Microsoft Fabric should be treated as an architecture exercise, not a simple migration project. The goal is to create a more reliable path from legacy sources to governed financial reporting.
A practical modernization path looks like this:
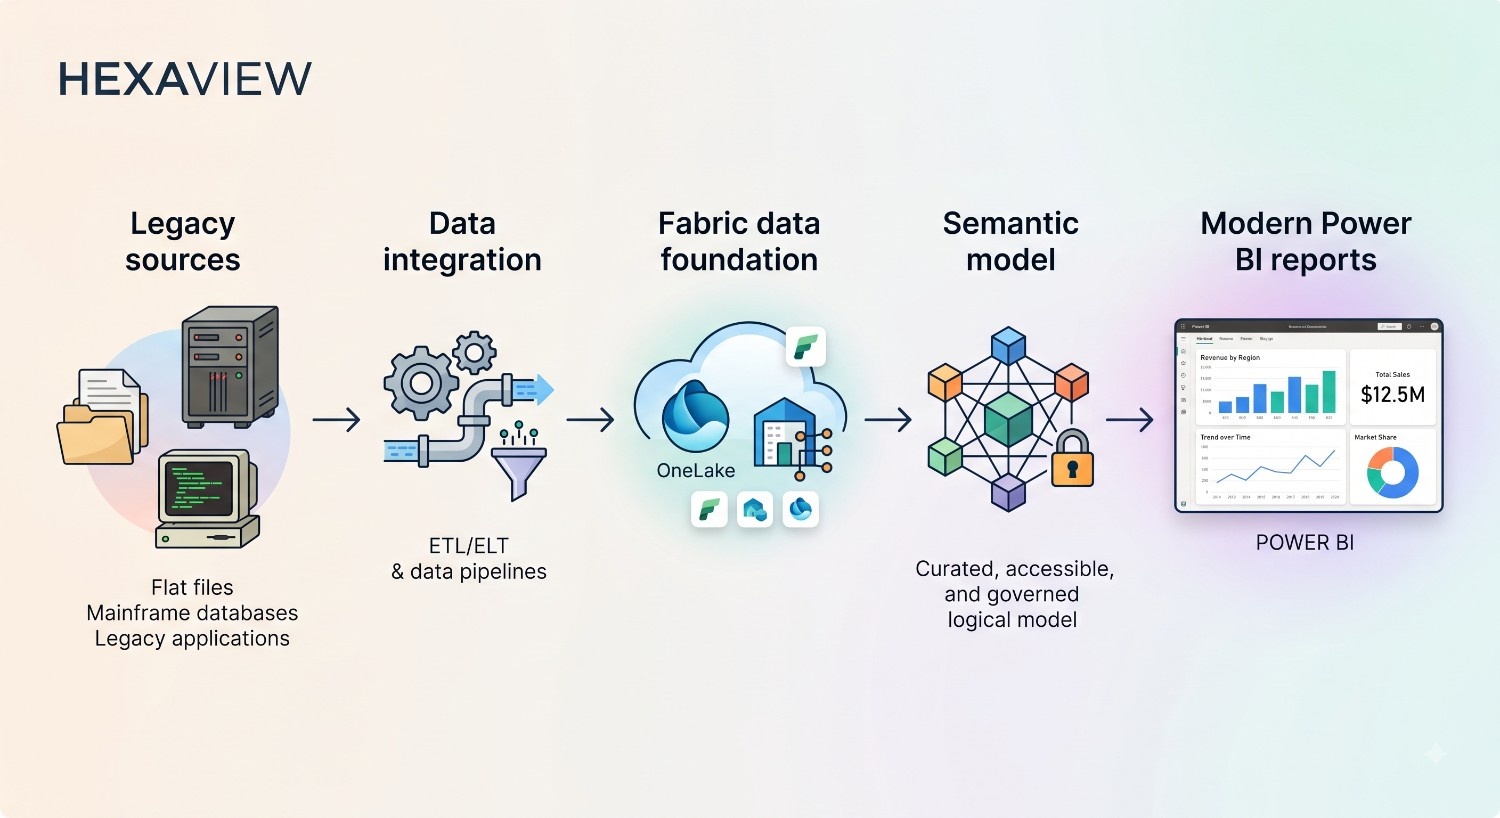
This approach can address fragmented data pipelines, duplicated datasets, legacy reporting environments, spreadsheet consolidation, inconsistent measures, refresh limitations, and governance gaps. However, organizations do not need to move everything into Fabric immediately.
An assessment-first approach can establish priorities by asking:
The answers help determine where Fabric can provide the greatest architectural value. Microsoft also recommends assessing existing Power BI environments and workloads before planning modernization, rather than treating every report as a migration candidate.
Yes, but effective governance depends on how the architecture and access model are designed. Microsoft Entra ID provides identity-based authentication, while Conditional Access can apply controls based on factors such as user identity, device state, and location.
Within Power BI, access can be further controlled through workspace permissions and semantic-model security, including row-level security or object-level security where appropriate. For sensitive financial information, Microsoft Purview adds classification, sensitivity labels, protection policies, and governance capabilities. Purview and Fabric can provide visibility from data sources through to Power BI reports, including lineage.
This matters because financial access should not be treated as a dashboard-level setting added at the end. Security requirements should influence data architecture, semantic model design, permissions, and information-protection policies from the start. Sensitivity labels can also propagate through supported downstream Power BI content, helping maintain protection as data moves toward consumption.
Not every financial organization needs a large Fabric implementation. A small Power BI environment with limited data sources may be manageable internally. The need for Microsoft Fabric Consulting Services typically increases with architectural complexity, migration risk, data volume, and governance requirements.
Consulting support can be valuable when teams need to plan or execute:
For example, a regulated enterprise with multiple financial systems, legacy BI environments, duplicated datasets, and complex access requirements may face challenges that go beyond dashboard development. In such cases, experienced consultants can help determine what should move to Fabric, what should remain unchanged, and how to sequence the modernization programme without disrupting critical financial reporting.
For financial organizations considering Fabric, the challenge is often deciding what to modernize, how to structure it, and in what sequence. Hexaview Technologies approaches Microsoft Fabric work across these stages:
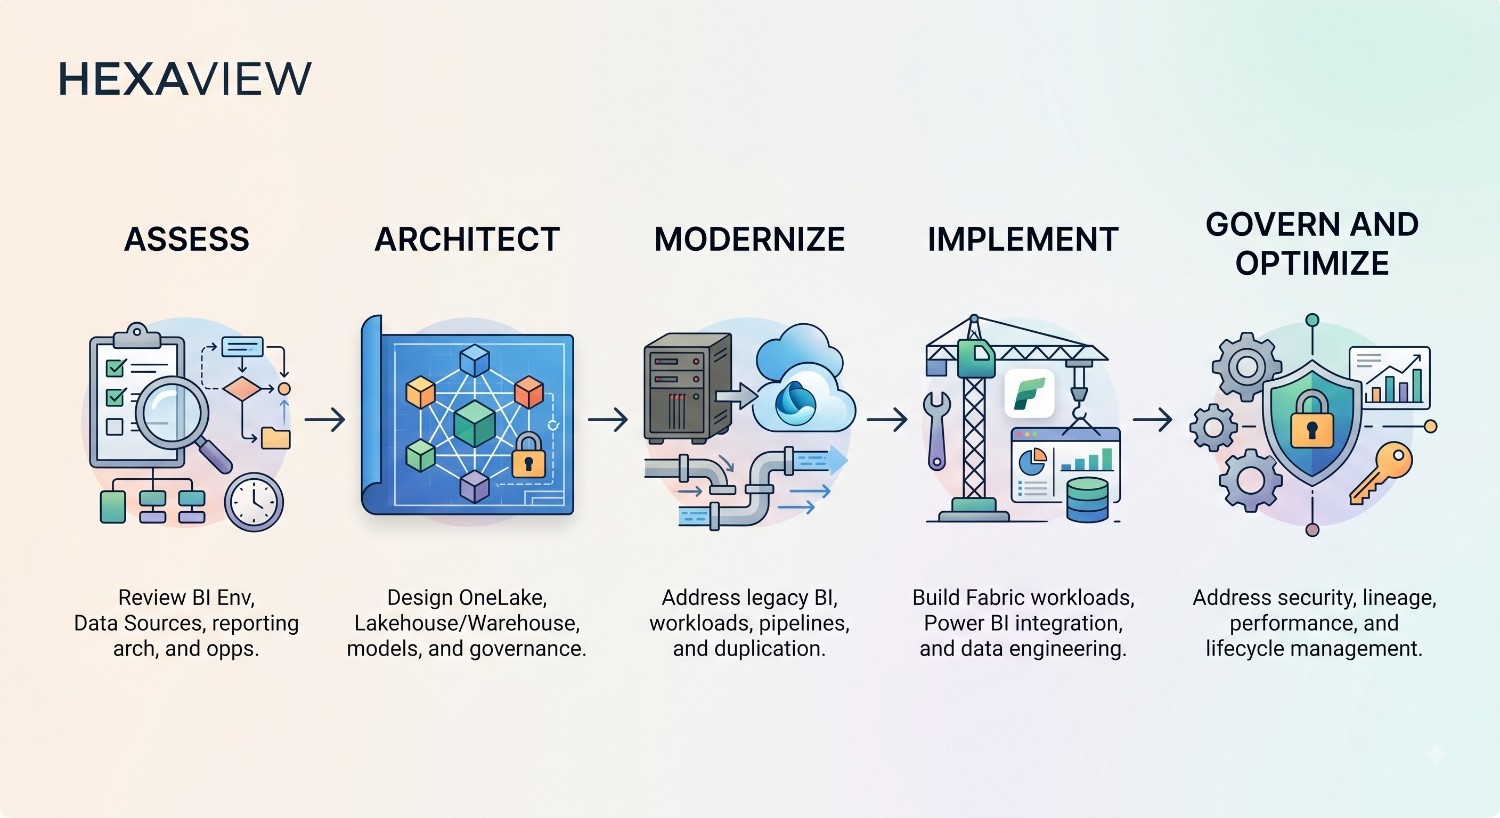
This approach is particularly relevant to regulated industries. Hexaview identifies financial services, wealth and asset management, insurance, and healthcare among the industries it serves, while its case studies include governed Microsoft Fabric reporting for wealth and trust management.
The differentiator is therefore not simply Fabric implementation. It is combining data-platform engineering with regulated industry experience to help organizations modernize without treating financial reporting as an isolated dashboard project.
Do you need Fabric if you already use Power BI? Not necessarily. Power BI can support sophisticated dashboards and semantic models on its own. The distinction is that Fabric expands the surrounding data platform and connects Power BI with broader data engineering, storage, analytics, and real-time capabilities.
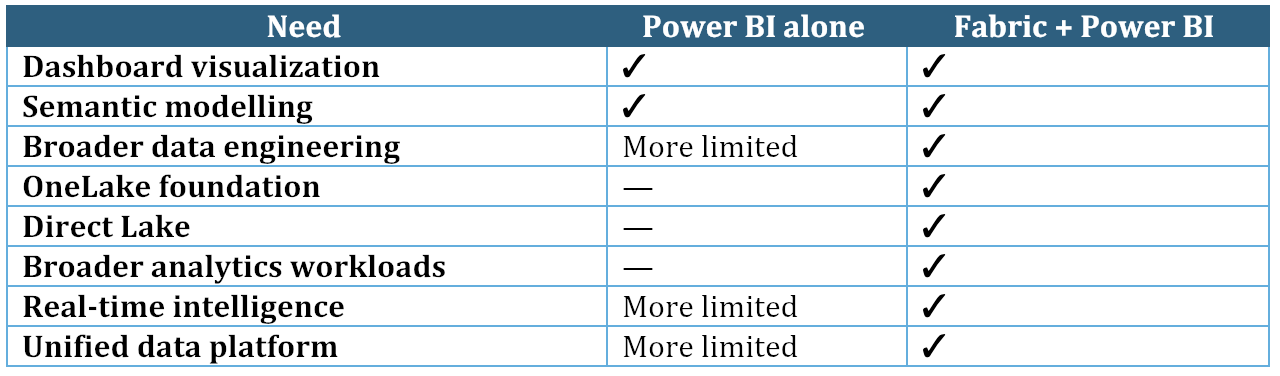
Microsoft describes Power BI as a Fabric workload that remains a distinct experience while integrating with other Fabric workloads. Therefore, Microsoft Fabric Power BI Integration is an expansion of the surrounding architecture, not a replacement for Power BI.
Fabric does not replace Power BI. It expands what sits behind it. It adds a broader foundation for data integration, OneLake storage, data engineering, semantic modelling, governance, Direct Lake, and real-time analytics. Power BI then delivers the dashboards and business insights built on that foundation.
For financial organizations planning this architecture, Hexaview Technologies can help assess existing environments, design the target architecture, and implement a governed modernization roadmap.
How does Microsoft Fabric improve Power BI financial dashboards?
Fabric expands the data foundation behind Power BI by bringing data integration, storage, engineering, governance, and analytics into one platform. OneLake provides shared storage, while semantic models can centralize business logic. Direct Lake can also provide a low-latency path for suitable Fabric-based analytical workloads.
Can Power BI connect directly to Microsoft Fabric?
Yes. Power BI is natively integrated with Fabric. For example, Power BI can create semantic models from Fabric Lakehouse data, including Direct Lake models that access OneLake data without traditional import duplication.
What is the role of OneLake in financial dashboards?
OneLake acts as Fabric's common data foundation. It allows different Fabric workloads to work with shared data, reducing unnecessary movement between engineering, analytics, and Power BI workflows.
Is Direct Lake better than Import for financial dashboards?
Not universally. Direct Lake is suited to large Fabric datasets and frequent data availability needs, while Import remains appropriate for many self-service and other workloads. Model design and workload requirements should determine the choice.
Can Microsoft Fabric support real-time financial dashboards?
Yes. Fabric Real-Time Intelligence can ingest, process, analyze, visualize, and act on streaming data. This differs from standard Power BI reporting, which typically focuses on governed analytical models and business reporting.
Does a company need Microsoft Fabric if it already uses Power BI?
Not necessarily. The decision depends on data complexity, scale, governance requirements, real-time needs, and modernization goals. Power BI may be sufficient for simpler reporting environments; Fabric becomes more relevant when organizations need a broader unified data platform.








.svg)



.svg)